
The Technical Analysis Guide
1. Introduction to Technical Analysis

Overview
Technical analysis forecasts future price movements of financial-traded assets using past market data like price and volume. It applies to stocks, indices, Forex pairs, and commodities.
Key Aspects
- Current Price: Evaluating the asset's present market price.
- Price History: Analyzing historical price movements.
Major Assumptions
- Price Discounts Everything: All news and updates reflect instantly in prices.
- Price Moves in Trends: Financial markets exhibit long-term trends.
- History Repeats: Market behaviors often replicate due to human psychology.
2. Popular Technical Analysis Indicators
Technical indicators use price volatility and volume to analyze trends and generate buy/sell signals.
Common Indicators
- Moving Average Convergence Divergence (MACD)
- Relative Strength Index (RSI)
- Moving Averages (MAs)
- Bollinger Bands
- Stochastic Oscillator
- Accumulation / Distribution
- Average Directional Index (ADX)
- Correlation Coefficient
- Chaikin Money Flow
- On-Balance Volume (OBV)
- William %R
- Volume-Weighted Average Price (VWAP)
3. Major Types of Charts
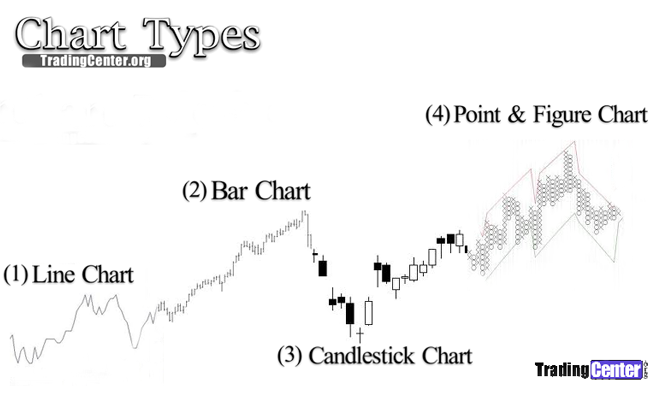
Charting is key for technical analysts. Types include:
- Line Chart
- Bar Chart
- Candlestick Chart
- Point and Figure Chart
4. Harmonic Chart Patterns
Harmonic trading uses geometry and fractals, such as:
- ABCD Pattern
- Three-Drive Pattern
- Gartley 222 Pattern
- Harmonic Bat Pattern
- Harmonic Crab Pattern
5. Elliott Wave Principle and the Stock Market

Elliott Wave patterns involve impulsive and corrective phases.
- Impulsive Phase: Moves with the trend.
- Corrective Phase: Moves against the trend.
Elliott Wave Principle
6. The Wyckoff Trading Method
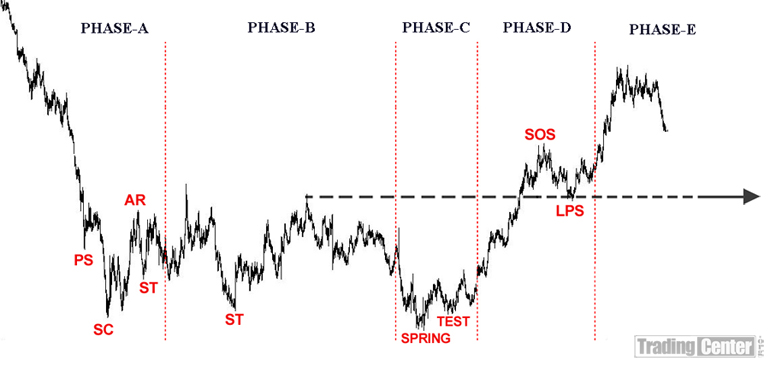
Wyckoff's method identifies market cycles:
- Accumulation Phase
- Uptrend Phase
- Downtrend Phase
- Distribution Phase
Five-Step Method
- Analyze trend dynamics.
- Select assets aligned with the trend.
- Use volume for confirmations.
Wyckoff Method Tutorial
7. TD Sequential

Key Features
- Counter-trend tool for trend exhaustion.
- Works on candlestick or bar charts.
- Phases include a 9-count setup and 13-count countdown.
TD Sequential Tutorial
8. Pivots
Pivot points calculate key price levels:
- PP = (High + Low + Close) / 3
Support and Resistance
- Support (S1, S2, S3)
- Resistance (R1, R2, R3)
9. Fibonacci Sequence

Key Levels
- Retracement Levels: 0.236, 0.382, 0.618
- Extensions: 1.618, 2.618
Fibonacci Tools
10. RSI Precision

RSI Precision enhances RSI with momentum and volatility indicators.
RSI Precision on TradingView
11. PriceMomentum Chart

PriceMomentum focuses on percentage changes, market volatility, and periodic momentum shifts.
Features
- Highlights percentage changes over prices.
- Useful for spotting key market shifts.
PriceMomentum Chart Analysis
Building a Reliable Technical Analysis Framework
Steps
- Identify market trends.
- Use Wyckoff phases and moving averages.
- Ensure assets align with market sentiment.
- Avoid overbought conditions using RSI Precision.
- Analyze volume for confirmation.
- Recognize patterns and formations.
- Time entries using shorter timeframes.