
Understanding Technical Analysis and the Accuracy of Candlestick Patterns
Technical analysis is an essential methodology for forecasting the direction of prices through historical market data. It is widely used by traders to predict trends, identify potential reversals, and optimize entry and exit points. While its utility spans across asset classes—stocks, Forex, commodities, and cryptocurrencies—the accuracy of technical analysis often depends on the tools and patterns employed. This blog delves into the concept of technical analysis, highlights popular candlestick patterns, and evaluates their accuracy.
What is Technical Analysis?
Technical analysis is the study of price action and volume trends using charts and statistical tools. The underlying assumption is that historical price movements often repeat due to market psychology. Unlike fundamental analysis, technical analysis is entirely based on price data, making it universally applicable across all tradable assets.
Key Components of Technical Analysis
- Candlestick Patterns: Visual representations of price movements.
- Chart Patterns: Structures like triangles, channels, and head-and-shoulders.
- Indicators and Oscillators: Tools like RSI, MACD, and Bollinger Bands.
- Support and Resistance Levels: Zones where price tends to react.
Popular Candlestick Patterns and Their Accuracy
Candlestick patterns are one of the most popular tools for analyzing price movements. They provide insights into market sentiment and potential reversals. Here’s a look at the top patterns and their accuracy rates:
1. Doji Candlestick
A Doji occurs when the opening and closing prices are almost identical, forming a small or non-existent body.
- Type: Reversal/Indecision
- Accuracy: ~50-55%
- Significance: A Doji signals indecision, but its reliability improves when combined with support/resistance levels.
2. Hammer and Hanging Man
-
Hammer: Forms at the bottom of a downtrend, signaling a reversal.
-
Hanging Man: Forms at the top of an uptrend, signaling a bearish reversal.
-
Accuracy: ~60-65%
-
Key Insight: Reliability increases when paired with volume analysis.
3. Bullish and Bearish Engulfing Patterns
These patterns consist of a smaller candlestick followed by a larger one that completely engulfs it.
-
Bullish Engulfing: Appears at the end of a downtrend, signaling upward momentum.
-
Bearish Engulfing: Appears at the end of an uptrend, signaling downward momentum.
-
Accuracy: ~65-70%
-
Key Insight: Stronger signals occur when supported by high trading volume.
4. Morning Star and Evening Star
These three-candlestick patterns indicate a reversal.
-
Morning Star: Signals bullish reversal.
-
Evening Star: Signals bearish reversal.
-
Accuracy: ~70-75%
-
Key Insight: Works best when the third candlestick shows strong confirmation.
5. Shooting Star and Inverted Hammer
-
Shooting Star: Forms at the top of an uptrend, signaling bearish reversal.
-
Inverted Hammer: Forms at the bottom of a downtrend, signaling bullish reversal.
-
Accuracy: ~60-65%
-
Key Insight: Confirm signals with subsequent price action.
Chart Patterns & Probabilities
Chart patterns are distinct formations on a price chart of a financial-traded asset. There are many different types of chart patterns that are distinguished by a wide variety of unique features. When a chart pattern is confirmed, there is a high probability that a certain (upward/downward) price movement will occur in the near future. A chart pattern is not able to predict with certainty a future price movement, however, it can indicate a high-probable trend reversal or continuation. Chart patterns are very useful in confirming the indications of other technical analysis tools such as MACD or RSI.
Two Categories of Chart Patterns
There are two major pattern categories:
- Reversal Patterns: Signal the end of the current trend.
- Continuation Patterns: Signal that the price trend is likely to continue in the same direction.
(Α) MAJOR REVERSAL CHART PATTERNS
1. Head and Shoulders Patterns
- Reliability: 7/10
The Head and Shoulders pattern is widely used among traders and is considered one of the most reliable reversal patterns. The timeframe of these patterns includes a few weeks to many months. There are two types of head and shoulders chart patterns:
-
Head and shoulders top: Signals the end of an uptrend.
- Success rate: 81%
- Average decline: 16%
- Percentage meeting target: 51%
-
Head and shoulders bottom (inverse head and shoulders): Signals the reversal of a downtrend.
- Success rate: 90%
- Average rise: 45%
- Percentage meeting target: 71%

2. Double Tops and Bottoms Patterns
- Reliability: 4/10
Double tops and bottoms are common patterns but are not considered highly reliable. These patterns are confirmed when a price movement hits support or resistance levels twice but fails to break through. Timeframe: A couple of weeks to several months.
-
Double Bottom
- Success rate: 81%
- Average rise: 43%
- Percentage meeting target: 71%
-
Double Top
- Success rate: 73%
- Average decline: 14%
- Percentage meeting target: 45%

3. Triple Tops and Bottoms Patterns
- Reliability: 5.5/10
Triple tops and bottoms form when the price tests support or resistance levels three times without breaking through. These patterns often indicate fast and strong trend reversals.
-
Triple Top
- Success rate: 75%
- Average decline: 14%
- Percentage meeting target: 49%
-
Triple Bottom
- Success rate: 86%
- Average rise: 44%
- Percentage meeting target: 72%

4. Rounding Top and Bottom Patterns
- Reliability: 8.5/10
Also known as saucer patterns, these are very reliable and indicate significant uptrend/downtrend reversals after long consolidation periods. Timeframe: Several months to several years.
-
Rounding Top
- Success rate: 87%
- Average decline: 19%
- Percentage meeting target: 13%
-
Rounding Bottom
- Success rate: 97%
- Average rise: 58%
- Percentage meeting target: 64%

(Β) MAJOR CONTINUATION CHART PATTERNS
5. Cup and Handle Patterns
- Reliability: 9/10
The Cup and Handle is a continuation chart pattern indicating that an uptrend has paused but will not reverse. Timeframe: A few months to a couple of years. Both bullish and bearish patterns are extremely reliable.
-
Cup and Handle (bullish continuation)
- Success rate: 95%
- Average rise: 52%
- Percentage meeting target: 62%
-
Inverted Cup and Handle (bearish continuation)
- Success rate: 83%
- Average decline: 17%
- Percentage meeting target: 62%

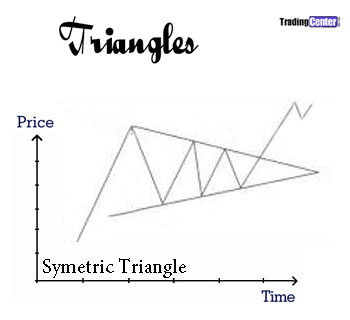
6. Triangles Chart Patterns
- Reliability: 6/10
Triangles are common patterns, categorized into three types: Symmetrical, Ascending, and Descending. Timeframe: A couple of weeks to several months.
-
Ascending Triangle (bullish trend)
- Success rate: 83%
- Average rise: 43%
- Percentage meeting target: 70%
-
Descending Triangle (bearish trend)
- Success rate: 87%
- Average decline: 15%
- Percentage meeting target: 50%
-
Symmetrical Triangle
- Bullish breakout:
- Success rate: 75%
- Average rise: 34%
- Percentage meeting target: 58%
- Bearish breakout:
- Success rate: 63%
- Average decline: 12%
- Percentage meeting target: 36%
- Bullish breakout:
7. Flag and Pennant Patterns
- Reliability: 5/10
Flag and Pennant are continuation patterns signaling trend continuation after a sharp advance or decline. Confirmation requires a significant increase in trading volume.

Enhancing Accuracy with Indicators
While patterns are invaluable, combining them with technical indicators can significantly improve accuracy. Examples include:
- Relative Strength Index (RSI): Identifies overbought/oversold conditions.
- Moving Average Convergence Divergence (MACD): Highlights momentum shifts.
- Bollinger Bands: Detects volatility and potential breakouts.
Conclusions and the Important Role of Trading Volume
- Spot Patterns on high timeframes (Daily and higher): Patterns on high timeframes are more reliable than those on lower timeframes.
- Volume is the key for validating any pattern: Significant trading volume at critical points validates patterns and reduces the probability of fake patterns.
- Chart patterns should not be used in isolation: They should confirm indications from other tools such as MACD, Support/Resistance, and Fibonacci Retracement.
The Limitations of Technical Analysis
Despite its advantages, technical analysis is not foolproof. Here are some challenges:
- Subjectivity: Pattern recognition can vary between traders.
- False Breakouts: Patterns may fail in volatile or illiquid markets.
- Overfitting: Relying on too many indicators can lead to confusion.
Mitigating Limitations
- Combine technical analysis with fundamental analysis.
- Use multiple timeframes for confirmation.
- Backtest strategies before deploying them in live markets.